
Doolta
mAPI-ng
Live site →Explainable, falsifiable incident diagnosis for your Go APIs: Go observability, ClickHouse, a likely cause instead of a wall of graphs.
Project Details
- Real problemA Go endpoint slows down or starts failing in production: what is the most likely cause, and what should you check first? Classic stacks (OTel + Prometheus + Grafana) answer with a wall of graphs you have to interpret yourself, at a high onboarding and interpretation cost.
- ConstraintsStay falsifiable: every proposed cause must be dismissible by contrary evidence, so the system never invents a diagnosis. Stay simple to instrument (no YAML, no Prometheus/Grafana stack to operate). Stay efficient at high request volume without exploding the amount of data transmitted and stored.
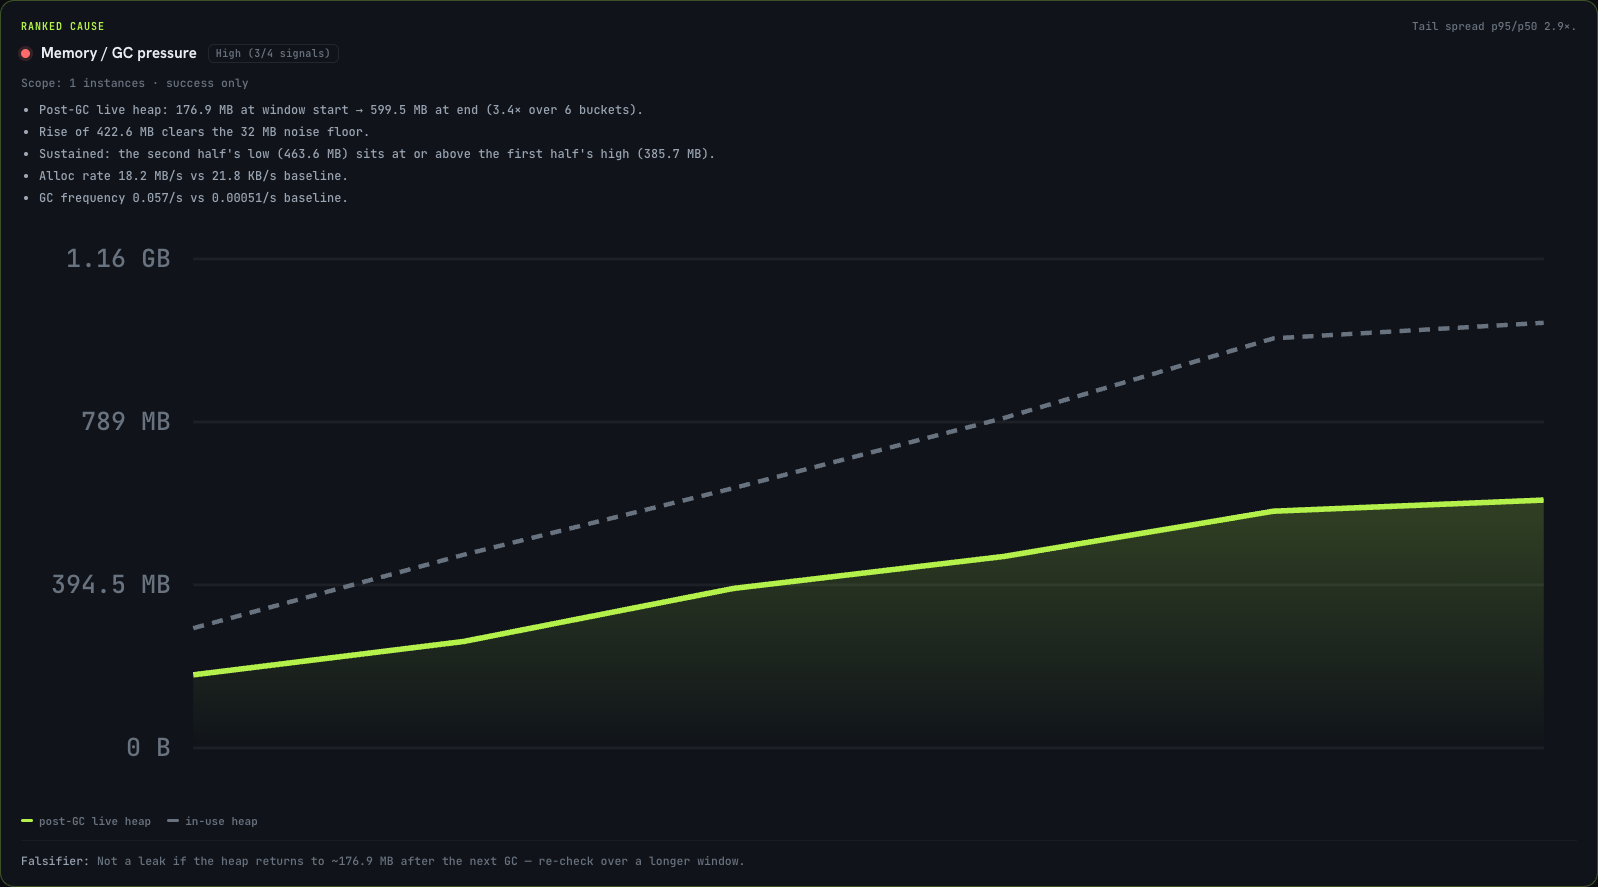
- Structural choicesClient-side aggregation into a DDSketch before sending. Compact summaries stored in ClickHouse, rolled up into 1-minute, 1-hour, and 1-day tiers. Ranked diagnosis across 8 cause families (memory/GC, CPU, connection congestion, overload and timeouts, goroutine leaks, downstream/IO, instance-localized, release regression), each with its evidence and a line stating what would rule it out. Confidence expressed as a discrete tier (High/Medium/Low), never a fake-precision percentage.
- What it proves todayA complete MIT stack (client, server, protocol), self-hostable with one command, plus a public hosted service with byte-for-byte identical instrumentation. A complete commercial layer (billing, team invites, marketing surface) was built by composition on top of the open-source core, never by forking it.
- Associated offerFlash Audit: the same evidence-based diagnostic principle applied to your API in 3 to 5 days.
Diagnose, don’t just display
Most observability stacks answer an incident with graphs: interpretation is on you. mAPI-ng answers a precise question in plain language: why did this endpoint slow down, and what most likely explains it?
Every diagnosed cause comes with the evidence behind it and a line stating exactly what would rule it out. When nothing explains the anomaly, the system says so, “unattributed”, rather than inventing a reassuring but wrong explanation.
Minimal instrumentation, an architecture built for volume
On the client side, one recorder, one middleware, and one environment variable are enough: without it, instrumentation stays inert and transmits nothing, which lets instrumentation code ship independently of activation.
On the server side, metrics are aggregated in-process before transmission (DDSketch), then stored as compact summaries in ClickHouse with tiered roll-ups. This choice sharply reduces what is transmitted, stored, and queried compared to raw-event collection.
From open-source engine to a complete commercial product
The core (client, server, protocol) is an MIT, self-hostable project. Around that core, an entire commercial layer (Stripe billing, team invites, marketing surface, in-app documentation) was built by composition, never by forking: every feature stays optional and the binary degrades cleanly to community behavior when nothing is configured.
This project demonstrates a directly transferable capability: designing lightweight instrumentation, aggregating data efficiently, and turning metrics into an explainable, verifiable diagnosis instead of a wall of graphs.